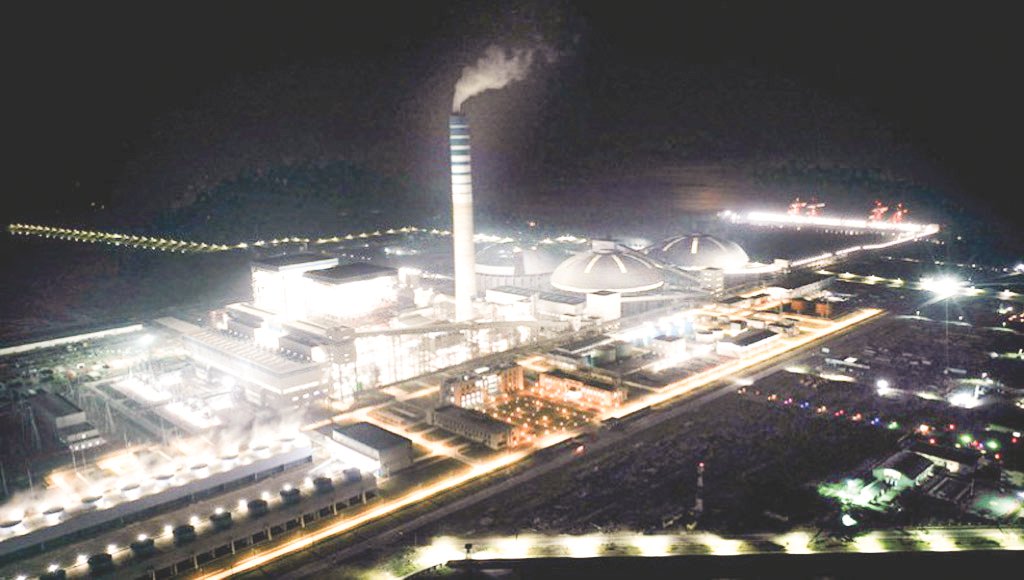
Air pollution presents a serious environmental and public health challenge in Bangladesh. According to global health reports, Bangladesh ranks among the most air-polluted countries, with particulate matter (PM2.5, PM10) concentrations exceeding World Health Organization (WHO) guidelines. While brick kilns, vehicle traffic, and construction dust contribute significantly to poor air quality, the industrial and agricultural sectors are also sources of carbon dioxide (CO2), sulfur dioxide (SO2), nitrogen oxides (NOx), and particulate emissions. Additionally, unregulated factory operations and chemical discharges release toxic fumes into the atmosphere. Meaningful reductions in air pollution require addressing the regulatory, technological, operational, and financial challenges those industrial facilities face. Here, Bangladesh like other developing nations face a dilemma of country’s need for cheap, reliable energy to grow its economies vis-a-vis to reduce emissions to protect its environment.
Comparative Air Pollutant Profiles (by IQAir World Air Quality Reports between 2022 and 2024) of several capitals are shown below. (Table 1)
Table 1
|
City |
PM2.5 Annual Average (µg/m³) |
CO2 Status |
SO2 Status |
NOx Status |
|
Dhaka |
69-78 |
Rapid emissions from industry boom |
Elevated: brick kilns and transboundary |
Increasing: vehicle emissions |
|
Delhi |
90-100+ |
Massive: vehicle and industry |
High: nearby coal power utilities |
High: heavy traffic and transport |
|
Islamabad |
40-50 |
Elevated: agricultural and vehicle expansion |
Moderate-high: pockets of industries |
Rising: risk after PM2.5 |
|
Kathmandu |
45-50 |
Low emissions: valley entrapment |
Low: regional transboundary risk |
Moderate: seen in traffic bottlenecks |
|
Colombo |
15-20 |
Lowest in South Asia |
Moderate: coastal shipping activities |
High: along major traffic corridors |
|
Beijing |
30-35 |
High: decoupled from peak air smog |
Reduced by industrial coal controls |
Moderate: through electric vehicles |
|
Tokyo |
9-11 |
Net-zero reduction trajectories |
Negligible: advanced industrial scrubbers |
Low: regulated carefully |
|
WHO Guideline |
5 |
Global climate target (net zero by 2050) |
20 µg/m³ (24-hour mean) |
25 µg/m³ (24-hour mean) |
Developed countries (USA, European nations, China, Brazil, etc.) bear the highest cumulative responsibility for emissions over time because they began burning fossil fuels for industrialization much earlier. USA alone is responsible for roughly 25% of all historical CO2 emissions since 1751. The Emission Database for Global Atmospheric Research (EDGAR) for 2022-24 shows a comparative state of annual national emissions of air pollutants of the countries (in metric kiloton (kt) or million metric tonnes (Mt) per year (yr); 1 Mt = 1,000 kt = 10,00,000 metric tons). (Table 2)
Table 2
|
Country |
CO2 (Mt/yr) |
SO2 (kt/yr) |
NOx (kt/yr) |
PM2.5 (kt/yr) |
PM10 (kt/yr) |
|
China |
12,100-12,600 |
7,500-9,200 |
15,500-17,200 |
7,800-8,500 |
12,100-13,500 |
|
USA |
4,700-5,000 |
1,800-2,200 |
7,200-8,100 |
4,200-4,800 |
14,000-15,500 |
|
India |
2,700-3,100 |
10,200-11,500 |
8,900-9,800 |
5,100-5,800 |
9,200-10,100 |
|
Brazil |
480-520 |
1,200-1,500 |
2,800-3,200 |
1,400-1,800 |
2,600-3,100 |
|
Vietnam |
320-360 |
750-880 |
820-950 |
410-480 |
620-710 |
|
Bangladesh |
100-120 |
380-450 |
410-490 |
310-360 |
520-600 |
Officially, Bangladesh does not have statistics on the daily national total mass (tonnage) of air pollutant emissions. However, the Country's average daily fine PM2.5 concentration reaches a hazardous level of around 66.1 micrograms per cubic meter (µg/m³), which is 4 times above the WHO daily target (15 µg/m³). This concentration surge during dry months (November-March) is 3.5-5 times higher than summer monsoon levels. Air pollution causes an estimated 242 premature deaths every day across Bangladesh's major urban areas due to high PM2.5 exposure.
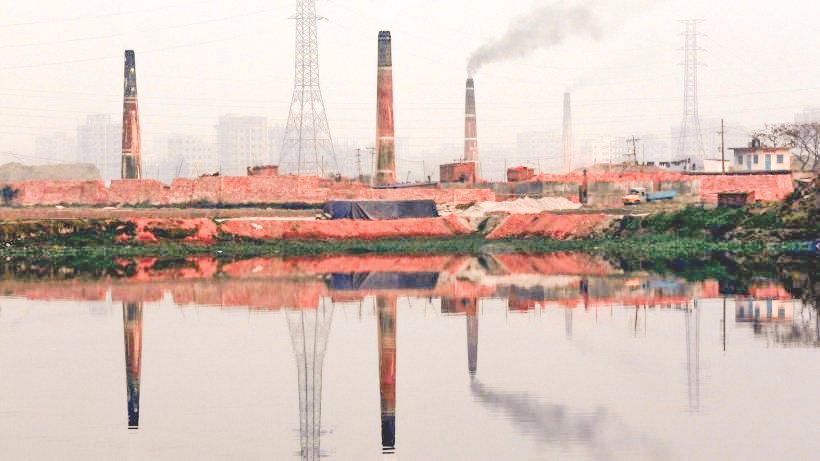
The transport sector is one of the drivers of urban air pollution in Bangladesh, accounting for roughly 28% of NOx emissions. Brick kilns contribute 18-27% of nationwide PM2.5 concentrations and up to 30-50% of ambient PM2.5 in the greater Dhaka region during the dry season. Construction dust is another leading local contributor to air pollution in urban areas, responsible for 8-30% of total particulate emissions depending on city, zone, and season. Heavy metal processing and blast furnaces of steel and metallurgical plants release very high levels of CO2, NOx, SO2, and fine dust. In cement manufacturing, the chemical calcination of limestone combined with fuel combustion in kilns produces CO2 and particulates. While public attention focuses on brick kilns and vehicles, intensive livestock farming is also a major, less-visible source of both local air pollution and greenhouse gases (GHGs), with the emission of CO2, NOx, Ammonia (NH3), Methane (CH4), particulate matter, etc. Similarly, the textile and ready-made garment (RMG) industries have substantial scope and a record of emitting air pollutants.
Per capita fossil CO2 emission in Bangladesh remains at 0.7 tons per person annually, and total nationwide CO2 emission is within 108-124 Mt/yr. Ambient Air Concentration Levels of particulate matters, Nox and SO2 in Bangladesh comparing Bangladesh National Ambient Air Quality Standards (BNAAQS) are stated below. (Table 3)
Table 3
|
Pollutant |
Annual Ambient Concentration |
BNAAQS Annual Mean |
|
PM2.5 |
65-80 µg/m³ (Nationwide average), >250 µg/m³ in winter |
15 µg/m³ |
|
PM10 |
120-150 µg/m³ (Nationwide average) |
50 µg/m³ |
|
NOx |
30-45 µg/m³ (Nationwide average) |
100 µg/m³ (0.053 ppm) |
|
SO2 |
5-10 µg/m³ (Nationwide average) |
80 µg/m³ (0.03 ppm) |
|
CO2 |
425-427 parts per million (ppm) |
- |
Producing 1 MWh (1 MW running for 1 hour) of electricity in Bangladesh results in varying levels of GHGs and local air pollutants depending on whether coal, Heavy Fuel Oil (HFO), or natural gas is used. Comparative Emission Estimates per 1 MWh of electricity of the power plant are as follows (Table 4)
Table 4
|
Pollutant |
Coal-fired Plant |
HFO-fired Plant |
Gas-fired Plant |
|
CO2 |
900 kg |
843 kg |
566 kg |
|
SO2 |
1.5-3.5 kg |
2.0-4.5 kg |
Negligible/Trace |
|
NOx |
1.2-2.5 kg |
1.0-2.0 kg |
0.4-0.8 kg |
|
Particulate
Matters |
Moderate (Controlled by Electrostatic Precipitator (ESP)) |
Moderate-High |
Low/Negligible |
The regulatory framework governing emissions in Bangladesh includes the National Air Quality Management Plan (2024-30), the Air Pollution Control Rules 2022, and environmental standards set under the Environmental Conservation Rules. Following these, the Environmental Clearance Certificate (ECC) acts as the primary driver of capital investments and plant/industry setup decisions. Conducting compulsory Environmental Impact Assessment (EIA) and adhering to standard stack height rules influence initial plant design, location selection, and upfront spending. However, many existing environmental rules seem to function primarily as administrative formalities rather than ongoing drivers of qualitative change. Activities like manual yearly stack testing, ambient air quality sampling, and annual clearance renewals are routinely completed to fulfill legal requirements. However, the Air Pollution Control Rules and the National Air Quality Management Plan have limited impact on daily operations due to under-resourced enforcement mechanisms at the Department of Environment (DoE) and a lack of binding sector-specific emissions targets.
The Air Quality Management Plan and the Air Pollution Control Rules serve as Bangladesh's core legislative and strategic framework to curb air pollution. The core objective of the National Air Quality Management Plan is to target a nationwide drop in PM2.5 concentrations to meet the WHO Interim Target (i.e., 35 µg/m³), controlling emissions from moving (vehicles), stationary (factories/chimneys), outdoor, and indoor sources. The Rules identify specific polluting activities by industrial production, vehicle movement, construction, and waste burning. The rules set emission standards and compliance plans with administrative enforcement.
The technical ability of the DoE to trace and monitor pollutant emissions from major sources- such as industries, power plants, brick kilns, etc. has a mix of rapidly advancing digital infrastructure and persistent operational gaps. While the DoE has established advanced macro-level tracking platforms, it lacks the enforcement data loops and micro-level oversight to reliably track individual polluters in real time. The tracking abilities of the DoE at present are as follows (Table 5)
Table 5
|
Sector |
Capability |
Limitations |
|
Power Plants and Industries |
Moderate: Emission Monitoring Systems (CEMS) and mandatory EIA; reliant on manual, periodic audits and stack-gas testing kits. |
Lack of automated real-time telemetry; emissions are rarely fed directly into a central automated enforcement server, relying on historical data/self-reporting. |
|
Brick Kilns |
Low-Moderate: Regulated under the Brick Kilns Establishment (Control) Act; utilizes satellite imagery and GIS mapping to locate clusters and damage. |
Field tracking limitations: tracking actual plume emissions day-to-day is impossible due to a lack of portable sniffers and manpower shortages. |
|
Ambient Air Quality |
High: 16 Continuous Air Monitoring Stations (CAMS); real-time Air Quality Index (AQI) platform launched in 2026. |
CAMS tracks six criteria that measure air quality; it cannot pinpoint a specific factory or kiln leaking pollutants. |
The DoE has modernized its high-level climate bookkeeping with the Climate Change MRV (Measurement, Reporting and Verification) Platform and online clearance system for environmental reviews of industries to align with international climate goals.
A major gap in environmental management involves continuous emissions monitoring systems, which could allow regulators to track pollution levels in real time. Functional monitoring systems are currently installed in less than 30% of total power plant capacity, primarily within newer coal and combined-cycle gas facilities. The adoption and effectiveness of these continuous monitoring systems face several operational barriers. Real-time data is used internally by operators for maintenance. But it is rarely linked to a central monitoring database at the DoE or integrated into live operational dispatch decisions by the Bangladesh Power Development Board (BPDB). Additionally, installing continuous gas analyzers requires importing expensive equipment, which leads to very high capital costs and ongoing operational expenses. Operating sensors in heavy flue-gas environments requires frequent calibration. Bangladesh also lacks accredited local calibration laboratories and certified environmental technicians. Consequently, compliance relies on annual manual stack tests conducted by third-party laboratories, which encourage temporary equipment tuning before testing, but fail to drive continuous, long-term pollution control.
Industry bodies like the Bangladesh Independent Power Producers’ Association (BIPPA) collect electricity generation, fuel usage, and financial data from members, in general. The Association does not independently monitor or verify continuous emissions logs, as this is beyond the Articles of Association. However, the power plants are efficient and reliable abiding by the national regulatory compliances of the conservation of environment keeping in view of the international obligatory of controlling emissions of air pollutants. It is mandatory to submit the technical and environmental conservation clearance reports to the international financial institutions (World Bank (WB), Export Credit Association (ECA) for insurance coverage, Commerce Bank of Germany, Asian Development Bank (ADB), Islamic Development Bank (IDB), etc.) before approval and receiving foreign financial support. The matter is similar for local bank loans, where EIA is a mandatory requirement to identify, predict, and evaluate environmental impacts before a project is approved or implemented. During operations, the power plants maintain real-time data as per the prescribed charts and preserve these as per the regulations. The DoE inspects and checks each power plant physically once a year and, as necessary, through a framework of regulations, visits sites, monitors operations, and finally provides ECC to the plant.
The suitability of emissions reduction technologies varies depending on fuel type usage. Gas-fired facilities typically use low-NOx burners, coal plants rely on ESP, and HFO facilities utilize modern mechanical gasifiers. These standard technologies generally meet baseline regulations; still, technological gaps may remain for tracing pollutants and heavy oil emissions. Installing advanced control technologies, such as Flue Gas Desulfurization (FGD) and Selective Catalytic Reduction (SCR) systems for existing HFO-fired plants presents technical and financial challenges. These advanced retrofits cost a 10-15% increase in plant construction costs. Advanced systems also require large physical footprints for complex water treatment units and a high auxiliary power system, making it difficult to retrofit within tight space. New coal-fired mega-projects like Matarbari Power Plant and Rampal Power Station are built using ultra-supercritical technology equipped with advanced FGD and SCR systems to curb SO2 and NOx emissions. Historically, national environmental guidelines for smaller liquid fuel-burning reciprocating engines have been significantly more lenient compared to large-scale coal complexes. To address regulatory oversight during renewal processes, select power plants adopt solutions such as low-NOx burner modifications and fuel additive dosing systems. Operators also ensure HFO quality through choosing carefully before procurement and conducting batch test for low sulfur content (as much low), density and moisture at accredited facilities like SGS (Société Générale de Surveillance: Swiss-based testing, inspection and certification company) or Eastern Refinery Limited before offloading fuel deliveries.
Financial and operational structures pose the main obstacles to wider technology adoption. Power Purchase Agreements (PPAs) feature fixed tariff structures that do not allow independent power producers (IPPs) to pass non-revenue-generating retrofit costs on to buyers. Long payment cycles from the BPDB and foreign exchange liquidity shortages further restrict available cash flow. Concessional facilities, such as Bangladesh Bank's Green Transformation Fund, are underutilized due to complex eligibility rules, administrative delays, short repayment windows, and high collateral demands. Commercial bank loans carry high interest rates, and private/foreign lenders are often unwilling to fund compliance equipment without sovereign guarantees. Meanwhile, public and development finance sources involve lengthy approval processes and strict environmental, social, and governance compliance burdens that medium-sized operators struggle to process. These cannot justify the investment in the most modern pollution control retrofits.
Regulatory enforcement currently consists of visits by the DoE once or twice a year. Most inspections are announced beforehand, though unannounced visits occur following public complaints. When non-compliance is identified, the DoE issues administrative Show Cause Notices, summons management to formal hearings, and imposes fines or corrective action plans. Severe consequences include temporary withholding of clearance certificate renewals, grid disconnections, or plant shutdown instructions.
Providing targeted tax incentives and duty exemptions for all industrial and agricultural sectors would make clean-technology retrofits economically viable. Countries (China, India, South Africa, Germany, and the USA) use tax incentives and duty exemptions on clean thermal fuel energy and heating technologies to lower upfront costs. Easy access to concessional green funds and accredited local technical support facilities would also lower the operational costs of continuous monitoring and advanced pollution control hardware. Now, Bangladesh needs to balance between ‘cheap, reliable power sustains the Bangladesh economy and clean power shields the earth’.
Download Special Article As PDF/userfiles/EP_24_10_SA.pdf
Colonel (retd) Engineer A R Mohammad Parvez Mazumder, afwc, psc